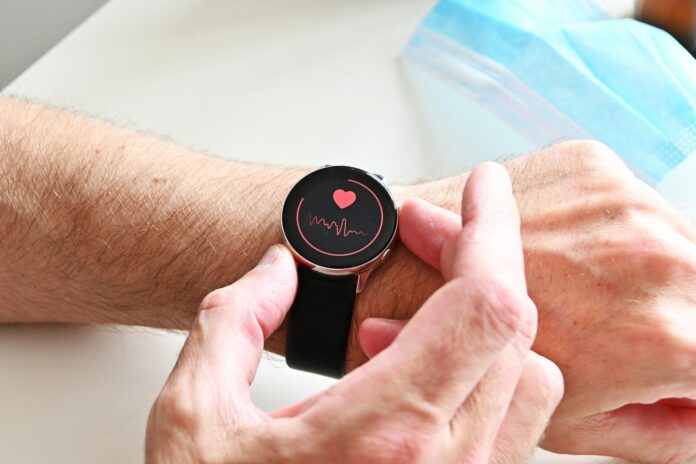

A normal resting heart rate for adults is 60 to 100 beats per minute, but that range is so wide it tells you little. In a large US survey of healthy adults, the middle half of men aged 40 to 59 sat between 61 and 77 bpm, and women of the same age between 64 and 79 bpm. Where you fall in that spread, and how your number moves over months, says far more about your fitness and long-term health than whether you are “inside the normal range”.
Key takeaways
- The official normal range is 60–100 bpm, but most healthy adults over 35 sit between about 60 and 80 bpm.
- In men, resting heart rate barely changes with age; in women it drifts down slightly until about 40, then levels off. Women average about 3 bpm higher than men.
- Across 46 studies and 1.2 million people, every 10 bpm higher resting heart rate came with about a 9% higher risk of death from any cause.
- Your own trend matters more than the population chart. A rise of 5–10 bpm over your usual baseline for several days is a signal to look at sleep, stress, illness or training load.
- Regular aerobic training is the most reliable way to lower it. Strength work helps your health in other ways but moves resting heart rate less.
What resting heart rate actually measures
Your resting heart rate is how many times your heart beats in a minute when you are awake, calm and still. It reflects how much blood your heart pushes out with each beat and how your nervous system is set at rest. A fitter heart pumps more blood per beat, so it needs fewer beats to do the same job.
That is why Mayo Clinic notes that very fit athletes can sit close to 40 bpm while most adults fall somewhere between 60 and 100. It is also why the number is sensitive to so much else: sleep, caffeine, alcohol, dehydration, heat, stress, illness and some medicines all push it around.
Resting heart rate is a different measure from heart rate variability, which looks at the tiny changes in timing between beats. Both are useful recovery signals, and our guide to HRV explained covers the other half of the picture.
Resting heart rate by age: the chart
The best population data come from the US National Health and Nutrition Examination Survey (NHANES). Between 1999 and 2008, examiners took the seated pulse of more than 14,000 adults after about four minutes of quiet rest. The researchers removed people with infections, thyroid problems, pregnancy and heart-rate-changing medicines such as beta-blockers, so the numbers describe broadly healthy adults.
| Age | Sex | Average | Middle 50% (25th–75th percentile) | Lowest 10% below | Highest 10% above |
|---|---|---|---|---|---|
| 20–39 | Men | 71 bpm | 61–76 | 55 | 84 |
| 20–39 | Women | 76 bpm | 66–82 | 60 | 89 |
| 40–59 | Men | 71 bpm | 61–77 | 55 | 85 |
| 40–59 | Women | 73 bpm | 64–79 | 59 | 86 |
| 60–79 | Men | 70 bpm | 60–75 | 54 | 84 |
| 60–79 | Women | 73 bpm | 64–78 | 59 | 86 |
Source: Ostchega et al., National Health Statistics Reports No. 41, CDC/NCHS, 2011. Seated, manually counted radial pulse.
How to read the chart
- Age changes less than you think. In men there was no meaningful trend across the adult age groups. Women’s average fell from 76 to 73 bpm between their 20s–30s and their 40s, then held steady.
- A low number is common in healthy men. About 15% of healthy men had a resting pulse under 60 bpm, against about 7% of women. Under 60 is not automatically a problem if you train and feel well.
- Where you sit inside the band matters. A 45-year-old man at 62 bpm and one at 82 bpm are both “normal”, but the research below suggests they are not in the same place.
One more caveat. Wearables measure differently. In a study of 92,457 adults who wore a wrist tracker for a median of 320 days, the average daily resting heart rate was 65 bpm, a little lower than clinic readings, partly because devices often take the lowest values during sleep or long still periods. Compare your watch with your watch, and your finger count with the chart.
Why a lower resting heart rate is linked with a longer life
The link between resting heart rate and survival is one of the most consistent findings in cardiology. A 2016 meta-analysis in the Canadian Medical Association Journal pooled 46 studies covering more than 1.2 million people. Each 10 bpm higher resting heart rate was associated with a 9% higher risk of death from any cause and an 8% higher risk of cardiovascular death. Compared with the lowest heart-rate group, people over 80 bpm had about 45% higher risk of dying from any cause.
Is that just a fitness effect in disguise? The Copenhagen Male Study tested exactly that. It followed 2,798 healthy middle-aged men for 16 years, with fitness measured on a bike test. Even after adjusting for fitness, leisure-time activity, smoking, blood pressure and other risk factors, risk rose by about 16% per 10 bpm. Men with a resting rate above 90 bpm had roughly three times the risk of men at 50 bpm or below.
Keep this in proportion. These are observational studies, so they show association, not proof that lowering your pulse by itself adds years. The authors of the 2016 analysis describe a high resting heart rate as a clear marker of poorer health, and point to physical activity as the obvious way to improve it. Think of the number as a gauge, not a target to chase with pills.
The 2-minute self-test: measure it properly
A single reading taken after climbing the stairs with a coffee in your hand tells you nothing. Here is how to get a number you can trust, following Mayo Clinic’s method.
- Pick the right moment. First thing in the morning, after you wake and use the bathroom, before coffee, before checking your phone, while sitting or lying quietly.
- Rest first. Sit still for one to two minutes, the way NHANES examiners did, breathing normally.
- Find the pulse. Place your index and middle fingers on the inside of your wrist below the thumb, or on the side of your neck next to the windpipe. Press gently.
- Count for 30 seconds and double it. Counting for 15 seconds and multiplying by four works, but small counting errors get multiplied too.
- Repeat for five to seven mornings and take the average. That is your baseline.
If you use a watch or ring, wear it every night and look at the weekly average, not a single day. The wearable study above found resting heart rate was stable for most people, but about 1 in 5 had at least one week where it swung by 10 bpm or more. It also ran slightly higher in January and lower in July, so expect a small seasonal drift.
What your number means
| Morning resting heart rate | What it usually means after 35 | What to do |
|---|---|---|
| Below 50 bpm | Common in trained endurance athletes. Less common otherwise. | Fine if you train and feel well. See a doctor if you are not trained or have dizziness, fainting or breathlessness. |
| 50–59 bpm | Typical of a fit, active adult. | Keep doing what you are doing. |
| 60–69 bpm | Healthy and close to the middle for most men; on the fitter side for women. | Room to drop a few beats with steady aerobic work. |
| 70–79 bpm | Around average for adults. Normal, but not where the lowest risk sits. | Add regular aerobic training; check sleep, alcohol and caffeine. |
| 80–100 bpm | Within the official range, but in the higher-risk band in population studies. | Build fitness, mention it at your next check-up, and check blood pressure. |
| Above 100 bpm at rest, repeatedly | Tachycardia. Not normal at rest. | See a doctor, sooner if you have symptoms. |
Your trend beats the chart
Researchers in the wearable study argued that each person has their own normal, and people’s normal values varied by up to 70 bpm. That is why a jump from your usual 58 to 66 bpm for several mornings deserves more attention than a friend’s 72.
Common reasons your morning rate creeps up by 5–10 bpm:
- Short or broken sleep. One of the fastest ways to raise it.
- Alcohol the night before. Many people see a clear bump the next morning.
- A cold, flu or other infection starting, often a day or two before symptoms.
- Too much training too fast. A raised resting rate with heavy legs and poor sleep is a classic sign you need a lighter week. Our deload week guide shows how to take one.
- Heat, dehydration and caffeine. Hot weather and too little fluid push the heart to work harder.
- Stress. A tough week at work or at home shows up in your pulse.
How to lower your resting heart rate
The largest review on this question, published in 2018, pooled 191 exercise studies in healthy people. Every type of exercise lowered resting heart rate on average, but only endurance training and yoga lowered it clearly in both men and women. People who started with a higher resting rate saw bigger drops, and younger groups dropped a little more than older ones, so the gains are real at 40 and 50, just slightly smaller than at 25.
A 12-week plan that fits 3–4 hours a week
- Two or three easy aerobic sessions a week, 30–60 minutes each. Brisk walking, cycling, rowing, swimming or easy running at a pace where you can talk in full sentences. This is the work that drives your resting rate down. Our zone 2 training guide explains how to pace it.
- One shorter, harder session. Four to six efforts of 2–4 minutes at a hard but controlled pace, with equal easy recovery. This raises your aerobic ceiling, which the VO2 max after 35 guide covers in detail.
- Keep two strength sessions. Lifting moves resting heart rate less, but it protects muscle, bone and blood sugar, and it belongs in any plan after 35.
- Protect sleep. Seven hours or more is the cheapest way to take a few beats off your morning number.
- Go easy on alcohol, and stop caffeine by early afternoon.
Measure your baseline in week 1 and again in weeks 6 and 12, always under the same conditions. A drop of a few beats over three months is a good sign your aerobic base is growing. Big drops are more likely if you start from little or no exercise.
For women: where the evidence differs
Women run about 3 bpm higher than men on average, so compare yourself with the women’s rows of the chart. Wearable research also links day-to-day rises in resting heart rate with phases of the menstrual cycle, so compare readings from the same point in your cycle month to month. Around perimenopause and menopause, hot flushes and broken sleep can nudge it up too; if you notice palpitations or a rate that stays high, talk to your doctor.
Safety note: See a doctor if your resting heart rate is regularly above 100 bpm, or below 60 bpm when you are not a trained athlete, especially with dizziness, fainting, chest pain, shortness of breath or a pulse that feels irregular. Seek urgent care for chest pain or fainting. If you take medicine that affects heart rate, such as beta-blockers, the charts above do not apply to you; ask your doctor what to expect.
Resting heart rate is one of six numbers worth tracking. Our guide to heart health after 35 covers the other five, including blood pressure and LDL cholesterol.
FAQ
What is a good resting heart rate for a 40-year-old?
Anything from about 50 to 70 bpm is a good place to be for most healthy, active 40-year-olds. In the NHANES data the average was 71 bpm for men and 73 bpm for women aged 40–59, so sitting below the average is a reasonable goal.
Does resting heart rate go up with age?
Not much. In healthy men it stayed almost flat from the 20s to the 70s. In women it fell slightly until about 40 and then levelled off. A rising number with age usually reflects falling fitness, weight gain, poor sleep or health changes, not age itself.
Is a resting heart rate of 55 too low?
Not if you exercise and feel well. About 15% of healthy men and 7% of healthy women in the US survey sat below 60 bpm. See a doctor if a low rate comes with dizziness, fainting, unusual tiredness or breathlessness, or if you are not active.
How quickly can exercise lower my resting heart rate?
Most people need several weeks of regular aerobic training before the morning number moves, and three months gives a fairer picture. If you start from a high rate and little exercise, you will usually see a bigger change than someone who already trains.
Is my smartwatch resting heart rate accurate?
Good wrist trackers are reasonably accurate at rest, but they often record lower values than a seated clinic check because they use sleep or long still periods. Use the watch to track your own trend, and use a finger count when you compare with the age chart.
Free tool: see what today’s habits could mean for your fitness at 50, 60 and 70 with Future You, then make your easy aerobic sessions more fun with Virtual Journeys, which turns your walks and rides into routes around the world.
Sources
- Ostchega Y, Porter KS, Hughes J, Dillon CF, Nwankwo T. Resting pulse rate reference data for children, adolescents, and adults: United States, 1999–2008. National Health Statistics Reports No. 41. CDC/NCHS, 2011.
- Zhang D, Shen X, Qi X. Resting heart rate and all-cause and cardiovascular mortality in the general population: a meta-analysis. CMAJ, 2016.
- Jensen MT, Suadicani P, Hein HO, Gyntelberg F. Elevated resting heart rate, physical fitness and all-cause mortality: a 16-year follow-up in the Copenhagen Male Study. Heart, 2013.
- Quer G, Gouda P, Galarnyk M, Topol EJ, Steinhubl SR. Inter- and intraindividual variability in daily resting heart rate: retrospective cohort study of 92,457 adults. PLOS ONE, 2020.
- Reimers AK, Knapp G, Reimers CD. Effects of exercise on the resting heart rate: a systematic review and meta-analysis of interventional studies. J Clin Med, 2018.
- Mayo Clinic. Heart rate: What’s normal? 2025.
This article is for general education and is not medical advice. Check with your doctor before starting a new training or nutrition plan, especially if you have a health condition.

